
Broadcom Inc.
NASDAQ: AVGO | Semiconductors & Infrastructure Software
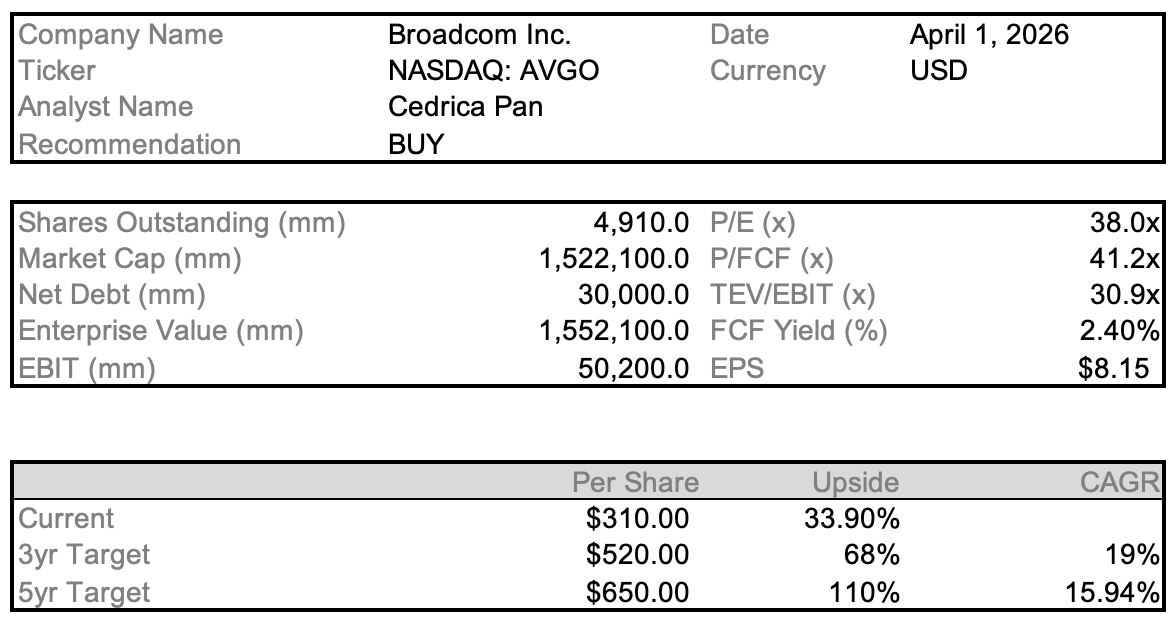
BUY | Price Target: $415.00 | Current Price: $310.00 | Upside: 34%
1. Investment Thesis
Broadcom is rated BUY with a 12-month price target of $415, representing 34% upside from the current $310 level. The investment case rests on two underappreciated earnings drivers: the conversion of Broadcom’s disclosed $73B AI semiconductor backlog into revenue over the FY2026-27 period, and the ongoing margin expansion in Infrastructure Software as VMware customers migrate to VCF subscription contracts. At 29x FY2026E EV/EBITDA, current valuation reflects neither the run-rate earnings power of the AI segment nor the recurring revenue profile of the post-transition software business.
Valuation Gap
Broadcom’s AI semiconductor revenue reached approximately $20B in FY2025, following growth of 220% in FY2024 and 65% in FY2025. Current sell-side consensus assumes deceleration to the 30-35% range in FY2026. The $73B backlog disclosed in December 2025, with an 18-month delivery window, implies AI semiconductor revenue of at least $48B cumulatively over FY2026-27, which exceeds the consensus FY2027E figure of $36-38B by an estimated 25-30%. The custom XPU programmes with Google, Meta, and a third undisclosed hyperscaler (reported to be Apple) are not yet fully reflected in consensus models. Each incremental XPU programme contributes an estimated $3-5B of annual revenue at gross margins of 70% or above.
In Infrastructure Software, consensus continues to treat VMware as a legacy asset exposed to customer attrition. Available data indicates that approximately 80% of VMware renewals have resulted in upsells to VCF bundles at 3-4x the prior license spend. On this trajectory, the segment is on track to deliver $25-26B of revenue in FY2026, with annual growth of roughly 10% and gross margins in excess of 90%. The post-integration economics differ materially from the pre-acquisition VMware profile.
Drivers of the Current Valuation
Three factors contribute to the current valuation gap. First, the stock declined approximately 30% from its prior peak during the early-2026 semiconductor multiple compression, which applied uniformly to cyclical and secular names. Second, the combination of semiconductor, software, and $65B of gross debt creates analytical complexity that limits generalist investor engagement with what has become, on a mix basis, primarily a recurring-revenue platform. Third, AI custom silicon revenue is not disclosed by customer, and XPU programmes are governed by non-disclosure agreements, which limits the market’s ability to model segment economics with precision.
Near-Term Catalysts
• Q2 FY2026 Earnings (May 2026): AI semiconductor revenue is expected in the range of $9.0-9.5B, above the current consensus of $8.5B, supported by the Google TPU7 ramp and Meta’s continued Matterhorn cluster expansion. A positive guidance revision would likely drive a re-rating.
• VCF Renewal Data (Q3 2026): Approximately 40% of the VMware installed base reaches the end of its three-year license cycle during this period. Upsell rates above 75% would support the $25B+ software revenue trajectory.
• Third Hyperscaler Disclosure (H2 2026): Management has referenced a third custom XPU customer. Confirmation would add an estimated $4-6B to addressable revenue and likely trigger consensus revisions.
• Balance Sheet Normalization: Net debt is projected to decline from $49B in FY2025A to $30B in FY2026E and $5B in FY2027E, as annual free cash flow of $37-48B is directed toward debt reduction. At net leverage below 1x EBITDA, Broadcom would have the capacity to initiate a meaningful buyback program.
Entry Point
The current price represents a 30% discount to the prior peak, while the AI backlog has expanded approximately 40% over the same period. Scenario analysis yields a weighted expected value of $430, with outcomes ranging from $218 in the bear case to $630 in the bull case. The 18-month backlog provides unusual forward visibility for a semiconductor business, and the VMware integration is past the highest-execution-risk phase.
2. Business Model & Strategy
Broadcom operates through two reporting segments: Semiconductor Solutions (63% of FY2025 revenue) and Infrastructure Software (37%). The corporate strategy is focused on establishing dominant positions in critical layers of enterprise compute infrastructure, spanning both silicon and virtualization/networking.
Semiconductor Solutions
Broadcom’s semiconductor business is concentrated in markets characterized by high switching costs. Its networking ASICs (Tomahawk, Jericho) are typically designed into hyperscaler switching fabrics 3-5 years ahead of revenue recognition. Once deployed, replacing the ASIC vendor requires substantial infrastructure rework, including changes to firmware, routing configurations, and operational tooling. This dynamic supports above-average pricing stability relative to commodity semiconductor markets.
The custom AI XPU business, which contributed approximately $20B of FY2025 revenue and is fully classified as AI-related, operates on a different model. Broadcom serves as a semiconductor design partner to Google (TPU), Meta (MTIA), and reportedly Apple, providing tape-out, validation, and production services in partnership with TSMC. Based on disclosed economics, Broadcom earns an estimated $0.15-0.25 per dollar of chip revenue in design fees in addition to assembly margins. Non-recurring engineering costs are borne by the customer, which limits Broadcom’s program-level capital risk. Gross margins on XPU revenue are in the 65-70% range.
Infrastructure Software and the VMware Integration
The $69B acquisition of VMware, which closed in November 2023, centered on transitioning the business from a perpetual license and maintenance model (EBITDA margins of approximately 40%) to a subscription bundle (VCF) targeting EBITDA margins above 70%. Management has executed comparable margin expansions at CA Technologies, Symantec, and Brocade, each of which was acquired at EBITDA margins of 40-45% and operated at 60-65% under Broadcom ownership. VMware entered the process at lower margins and is currently tracking toward the 70% level by FY2027.
The underlying economics are as follows. VMware’s prior perpetual license structure generated $5-6B in annual maintenance revenue at approximately 90% gross margin. Broadcom has converted a majority of those customers to VCF bundles at 3-4x the prior maintenance cost, though the VCF product includes an expanded feature set spanning hyper-converged compute, storage, and networking. On a per-core basis, pricing has moved from roughly $5-7 per month to $18-24. FY2024 infrastructure software revenue of $21.5B was affected by the transition, and the run-rate entering FY2026 is closer to $25B ARR.
Cost Structure
The combined cost structure supports a durable margin profile. Semiconductor cost of goods sold is dominated by TSMC wafer costs at 3nm and 5nm nodes, which have been growing at 5-7% annually, below Broadcom’s revenue growth rate of 20-25%. Infrastructure software cost of goods sold consists primarily of customer support and hosting, consistent with 90%+ gross margins. Blended gross margin is currently 65-67% and is projected to reach 68-70% by FY2028 as the software mix increases. R&D expense as a percentage of revenue has declined from 20% in FY2021 to 14% in FY2025, reflecting operating leverage on a relatively stable R&D headcount base.
Value Drivers
Three structural drivers support the earnings trajectory. First, AI XPU customer concentration: each additional hyperscaler program contributes an estimated $5-8B of annual revenue at high margins. Second, VCF upsell rates: every 5 percentage-point improvement in renewal upsell corresponds to approximately $1.2B of incremental annual software ARR. Third, debt reduction: each $10B of net debt repayment increases equity value by approximately $2 per share at constant enterprise value and expands the capacity for capital return.
3. Industry & Competitive Positioning
AI Infrastructure Demand
Hyperscaler AI capital expenditure has grown at annual rates in excess of 40%. Google, Meta, Microsoft, and Amazon have collectively guided to combined 2026 capex of more than $320B, a substantial portion of which is directed toward AI training and inference infrastructure. Demand for AI-optimized compute, including both GPUs and custom ASICs, currently exceeds available supply capacity at TSMC’s 3nm and 5nm nodes. Incumbent suppliers with established process relationships and qualified designs, including Broadcom, benefit from this capacity constraint.
Networking Position
In Ethernet AI networking, Broadcom holds an estimated 70% share of switch ASIC content deployed in hyperscaler AI clusters. Tomahawk 6 (102 Tbps), announced in FY2025, has generated backlog in excess of $10B. The AI networking segment has distinct technical requirements relative to traditional data center networking: latency specifications require the hyperscaler software stack, including RoCEv2 protocols and congestion control, to be co-designed with the underlying ASIC. This co-design reduces substitution optionality for customers within a given infrastructure generation.
Pricing
Broadcom’s pricing across switch ASICs, custom XPUs, and VMware VCF is primarily value-based rather than cost-based. In the XPU segment, custom silicon delivers performance-per-watt improvements of roughly 65% relative to general-purpose GPU training clusters, which translates into estimated annual operating savings of $200-400M for a typical hyperscaler customer. Broadcom prices to capture an estimated 30-40% of this benefit. For VCF, the product consolidates 3-4 point solutions (networking, storage, compute management) into a single platform, generating customer total cost savings of 20-30%. Broadcom prices the bundle to capture a portion of this savings while preserving customer ROI.
Competitive Landscape
The principal competitive risks are: (1) in-house ARM-based silicon development at hyperscalers, particularly for networking; (2) Marvell Technology in custom silicon, which is Broadcom’s closest XPU competitor but operates at meaningfully smaller scale; and (3) VMware customer attrition to Red Hat OpenShift or Nutanix. These risks are not viewed as imminent. Hyperscaler in-house networking ASIC development typically requires 4-6 years of R&D investment and is subject to the same TSMC capacity constraints affecting Broadcom. Marvell’s volume base is approximately one-quarter of Broadcom’s, which limits its ability to absorb the NRE costs required by large hyperscaler programs. VMware churn during the first full renewal cycle (FY2025-26) is tracking in the 10-15% range, consistent with management guidance and below the 20-30% assumed in the bear case.
4. Financial Analysis
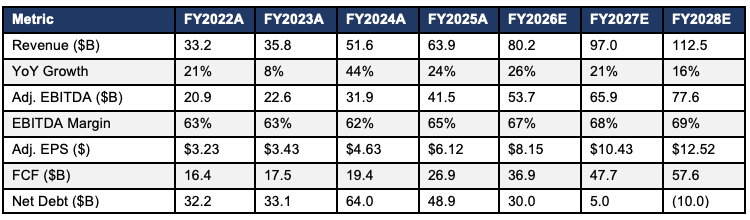
The FY2026-28 financial forecast reflects three concurrent drivers: AI revenue scaling, VMware’s contribution at normalized margins, and active debt reduction. In combination, these factors support EBITDA and EPS growth materially above recent trend.
Revenue Drivers
AI semiconductor revenue is the principal growth contributor. From approximately $20B in FY2025, the forecast is $35B in FY2026 and $48B in FY2027, implying growth of 75% and 37% respectively. The forecast is anchored to the disclosed $73B backlog with an 18-month delivery window. Even under an 80% backlog conversion assumption, cumulative AI revenue for FY2026-27 would total approximately $58B, compared with the aggregate forecast of $83B. The Tomahawk 6 backlog of more than $10B provides additional visibility within the networking segment.
Non-AI semiconductor revenue of approximately $20B in FY2025 is modeled at flat to +5% annually. This segment, which includes server storage controllers, fibre channel, and broadband access ICs, is relatively mature and mildly cyclical. The forecast does not assume recovery in the residential broadband end-market, historically 15-20% of segment revenue, prior to FY2028.
Infrastructure software revenue of $23.5B in FY2025 is modeled to grow 1% in FY2026, reflecting the residual run-off of perpetual license revenue, before accelerating to 12% in FY2027 as the VCF subscription base compounds. The renewal upsell rate is the most sensitive assumption. At the 80% upsell rate disclosed as Broadcom’s target, segment revenue would reach $28-30B in FY2027.
Margin Trajectory
EBITDA margin expanded 300 basis points in FY2025 from 62% to 65%. Further expansion is projected of 200 basis points in FY2026 to 67% and 90 basis points in FY2027 to 67.9%. The expansion is primarily driven by revenue mix rather than cost reduction. Incremental AI XPU revenue carries gross margins of 65-70%, and incremental VCF subscription revenue carries gross margins of 88-92%. As these higher-margin streams grow at above-average rates, incremental EBITDA margins are in the 75-80% range. On this basis, EBITDA growth of more than 30% annually through FY2027 is achievable even without growth in non-AI semiconductor revenue.
Cash Flow and Deleveraging
Broadcom generated $26.9B of free cash flow in FY2025 on $41.5B of EBITDA, representing a conversion rate of approximately 65%. After dividends of approximately $11.4B, cash available for debt reduction was approximately $15.5B, which supported the decline in net debt from $64B at the end of FY2024 (post-VMware) to $49B at the end of FY2025. In FY2026, free cash flow is forecast to rise to approximately $37B, leaving roughly $24B available for debt reduction after estimated dividends of $12.8B and bringing net debt to approximately $30B. By FY2027, net debt is projected to reach $5B. On these projections, by FY2028 Broadcom would generate $40-50B in annual free cash flow against a near-zero net debt position, providing substantial optionality for capital return that is not currently reflected in consensus estimates.
Key Inflection Points
Three variables will determine the trajectory of the investment case. First, the AI revenue exit rate in FY2026: a run-rate above $40B (versus the base case of $35B) would likely prompt upward revisions to FY2027 consensus. Second, VMware attrition: a stabilization of annual churn below 12% would support a re-rating of the software segment toward SaaS comparables. Third, net debt reduction: crossing below $10B of net debt in late FY2027 would allow for buyback capacity of $10-15B annually, corresponding to 2-3% of annual EPS accretion at current share count before operational growth.
5. Valuation
Methodology
Broadcom’s capital structure, with $65B of gross debt post-VMware declining toward an estimated $20B by FY2027, combined with $9-10B of annual non-cash intangible amortization from acquisition accounting, limits the usefulness of GAAP P/E as a valuation reference. FY2025 GAAP EPS of $4.77 understates operating earnings relative to adjusted EPS of $6.12, which excludes acquisition-related amortization and restructuring charges. EV/EBITDA is used as the primary valuation metric because it is insensitive to capital structure during the deleveraging period, allows direct comparison with both software peers (25-35x range) and semiconductor peers (18-22x range), and captures operating leverage consistently.
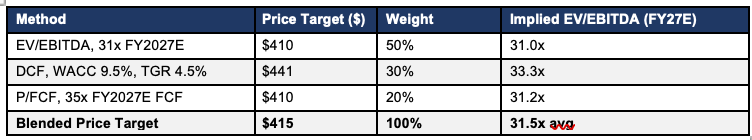
Primary Valuation: EV/EBITDA
A 31x multiple is applied to FY2027E adjusted EBITDA of $65.9B, implying an enterprise value of $2,043B. Deducting FY2026E net debt of $30B yields equity value of $2,013B, or $410 per share on 4.91B diluted shares. The 31x multiple reflects a projected 21% revenue CAGR over FY2025-27, EBITDA growth above 30%, a near-doubling of free cash flow over the forecast horizon, and an evolving business mix that positions Broadcom between pure semiconductor and pure software comparables.
DCF Cross-Check
The DCF uses a WACC of 9.5%, based on a 5.0% risk-free rate, a 4.5% equity risk premium, and a normalized beta of 1.10. The terminal growth rate is 4.5%, reflecting long-term free cash flow growth modestly above GDP. FCF inputs are $36.9B (FY2026E), $47.7B (FY2027E), and $57.6B (FY2028E), with terminal year FCF of $65B. The terminal value of $2,709B, calculated as $65B divided by (9.5% minus 4.5%), discounts to $2,083B at year 3. Combined with $113B of discounted interim FCFs and net of FY2026E net debt of $30B, the DCF yields an equity value per share of $441, approximately 6% above the primary target.
Sensitivity
At 25x FY2027E EBITDA, the low end of the sensitivity range, the implied price is $330. At 35x, consistent with a full software re-rating, the implied price is $495. At 22x EBITDA applied to reduced AI revenue, consistent with the bear case assumptions, the implied price is $218.
Peer Valuation
At $310, Broadcom trades at 28.9x FY2026E EV/EBITDA, a premium to pure-play semiconductor peers (Marvell at 22x, Qualcomm at 13x) and a discount to enterprise software infrastructure platforms (ServiceNow at 35x, Palo Alto Networks at 28x). Infrastructure Software accounts for 37% of revenue, with that share projected to expand, and the multiple is expected to converge toward the 31-33x range as the software mix reaches 40-45% of revenue in FY2027-28.
6. Catalysts
• Q2 FY2026 Earnings (May 2026, Near-Term): AI semiconductor revenue is expected at $9.0-9.5B, above consensus of $8.5B, which would likely prompt a revision of FY2026E estimates from $35B to the $38-40B range. Disclosure of additional XPU program expansion, including incremental Google TPU capacity or the Meta MTIA2 ramp, could support a further re-rating. Probability: 65%. Estimated share price impact: +12-18%.
• Third Hyperscaler XPU Disclosure (Q3-Q4 2026, Medium-Term): Management has referenced a third revenue-generating XPU customer, which consensus has attributed to Apple (inference chips for Apple Intelligence). Explicit disclosure, including via customer press release, would add an estimated $4-6B to addressable revenue. Probability: 55%. Estimated impact: +8-12%.
• VCF Renewal Rate Data (Q3 2026, Medium-Term): As the first full three-year VMware contract cycle concludes, upsell metrics will either support (above 75%) or challenge (below 65%) the software thesis. ARR disclosures during FY2026 earnings calls are the primary data points. Probability of upsell confirmation: 70%. Estimated impact if confirmed: +8-10%.
• Net Debt Below $30B (FY2026 Year-End): Crossing below 1x EBITDA net leverage, expected by October 2026, would enable management to initiate a formal buyback program. Annual repurchases of $8-12B would generate EPS accretion of 0.5-0.8% per year before organic growth. Comparable capital return announcements at peers have historically supported re-ratings of 10-15%. Probability: 80%. Estimated impact: +6-10%.
• Tomahawk 7 / Jericho 4 Pre-Announcement (H1 2027, Longer-Term): Broadcom has consistently pre-announced next-generation networking ASICs 18-24 months ahead of revenue recognition. A Tomahawk 7 announcement in H1 2027 would support the design win cycle through FY2029.
7. Risks
Principal Risks
• Hyperscaler AI Capex Cyclicality (High Impact, Medium Probability): The $320B+ in 2026 hyperscaler capex guidance represents a substantial step-up from prior levels, and may not be sustained through a macro downturn. A credit event, US recession, or escalation of trade tensions could reduce AI infrastructure spending by 15-20%, with a 12-month lead time. Given Broadcom’s 18-month backlog, the revenue impact would be felt principally in FY2027-28. A 20% shortfall in FY2027E AI revenue relative to the base case would reduce the price target by an estimated $55-65 per share. The backlog provides partial insulation, and non-AI semiconductor and software revenues serve as additional stabilizers.
• VMware Churn Above 20% (High Impact, Low-to-Medium Probability): The VCF pricing structure has drawn customer pushback. Gartner surveys indicate that 18-22% of VMware customers are actively evaluating alternatives, including Red Hat, Nutanix, and AWS VMware Service. If churn exceeds 20% against the 10-15% base case, FY2027 software revenue would be an estimated $4-5B below forecast. This represents the most significant risk to the bull case. Mitigating factors include the estimated $15-25M per-customer switching cost associated with migrating 10,000+ virtual machines to an alternative hypervisor, which is not fully reflected in survey responses.
• Antitrust and Regulatory Risk (Medium Impact, Low Probability): Broadcom’s share of switch ASICs (approximately 70%) and its position in enterprise virtualization post-VMware may attract regulatory scrutiny, particularly in the EU. A forced divestiture of VMware, which represents the tail scenario, would remove $6-8B of EBITDA. The probability is assessed in a 12-month horizon at under 10%.
• TSMC Capacity and Geopolitical Risk (Medium Impact, Medium Probability): Broadcom’s AI XPU programs are dependent on TSMC 3nm and 5nm production capacity in Taiwan. Disruption arising from political escalation, natural disaster, or operational factors would create a 6-12 month production gap that cannot be readily bridged via Samsung or Intel Foundry at comparable performance levels. This is a systematic risk across leading-edge semiconductor supply, and Broadcom’s concentration at advanced nodes increases relative exposure.
• Interest Rate Risk on Gross Debt (Low Impact, Low Probability): Broadcom’s $65B of gross debt is predominantly fixed-rate, with a weighted average maturity of 8.5 years and a weighted average coupon of approximately 5.2%. Current interest expense is therefore insensitive to near-term rate movements. The primary exposure is refinancing risk in FY2028-30 if rates remain elevated; given the projected near-zero net debt position by FY2027, this exposure is limited.
8. Scenario Analysis
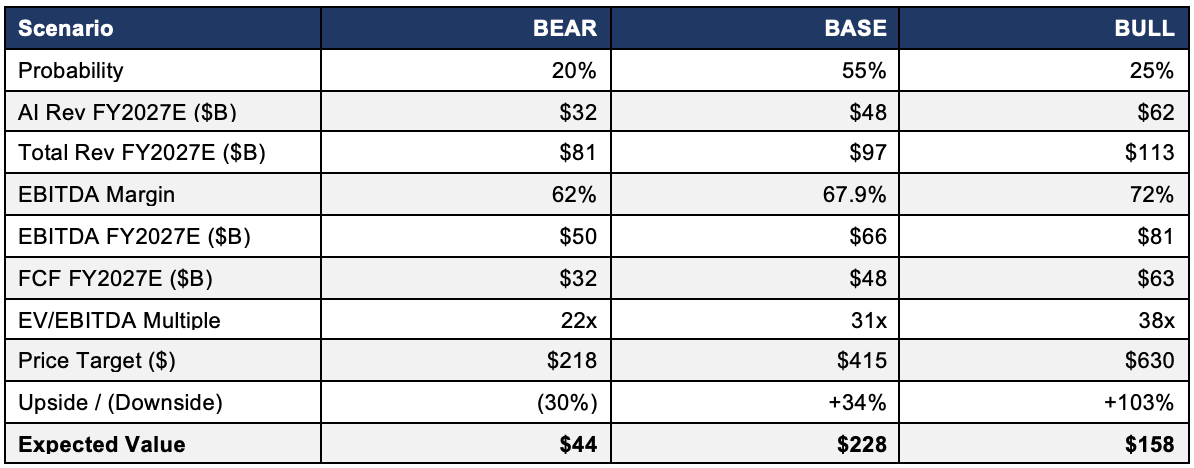
Bear Case: $218 (20% Probability)
The bear case assumes a combination of adverse outcomes: a 20% reduction in hyperscaler AI capex, VMware churn of 22%, and multiple compression to 22x EV/EBITDA as growth decelerates. AI revenue of $32B in FY2027 would represent 33% growth from FY2025A, a level that remains above historical averages but is materially below the trajectory implied by current backlog. In this scenario, the AI XPU franchise has lost share to in-house alternatives, and VCF ARR is in decline. Downside is partially supported by recurring free cash flow in excess of $26B, which provides valuation floor support in the $200-220 range on an FCF yield basis.
Base Case: $415 (55% Probability)
The base case assumes AI backlog conversion of 85%, VCF upsell rates of 78-80%, and a stable macro environment for enterprise IT spending. The $415 target reflects 31x applied to FY2027E EBITDA of $65.9B. The assumptions are not aggressive on a stand-alone basis; they require the disclosed backlog to be delivered and the VMware integration to remain on its current trajectory.
Bull Case: $630 (25% Probability)
The bull case assumes confirmation and ramp of a third hyperscaler XPU customer by FY2027, VCF upsell rates above 85%, and a re-rating of the blended multiple to 38x on a higher EBITDA base. At $62B of AI revenue and a 72% EBITDA margin, Broadcom’s absolute free cash flow generation would be among the highest in large-cap technology.
9. Conclusion
Broadcom is rated BUY. At $310, the shares do not reflect the combination of AI XPU revenue scaling above consensus estimates, continued VCF subscription upsells, a $49B deleveraging cycle, and Broadcom’s established positions in switch ASIC and XPU design. The early-2026 multiple compression was driven by macro considerations rather than fundamentals, and earnings power over the forecast horizon has improved over the same period.
The $73B disclosed AI backlog reduces earnings uncertainty for FY2026-27. The VMware integration has moved past its highest-execution-risk phase and is tracking ahead of consensus expectations. The balance sheet is in transition from an elevated leverage position toward a capital structure that will support meaningful buyback capacity and dividend growth within an 18-month horizon.
The 12-month price target of $415 is based on 31x FY2027E EV/EBITDA and is cross-checked by a DCF yielding $441 at a 9.5% WACC. This implies 34% upside, with a probability-weighted expected value across scenarios of $430. Key variables to monitor are VMware churn trending above 18% and any reduction in hyperscaler AI capex guidance.